entourage

week nine – thursday 26 september

independent study: context
Place your code into a range of different contexts and think about what it is you want your code to do, who it is aimed at, where it could be used etc.

Looking at these mockups I think the ones that have the most potential to be produced and personalised with the data that I am collecting is a set of posters – each one personalised for the person ordering it, a roll of stickers with some general things that people are angry about randomised through my code on them or perhaps a booklet in which each page is personalised based on the data. The pattern that is generated on wither the booklet or the poster could look something like that as seen on the billboard where the number of hands is a representative of the data gathered.

bringing 3d scan + data into processing

week nine – thursday 26 spetember

3d scan in processing

So, this scan loads in processing!!! maybe it was because I took a bit more time fixing up holes and refining this model than I did with the practice one. It still shows some errors but it works just fine. I tried to apply materials & shade in the MeshLab software but when I loaded these models into Processing they reverted back to the original obj. grey.

With a small amount of research I came across how to fill the colour of the PShape using the set.Fill(color()); function, when your float is placed before it. However I couldn’t choose a solid black fill as this removed all three dimensional definition to the shape.

data in processing

Finding a way to manipulate a PShape and generate multiple PShapes of the same obj file has proven to be quite the challenge. I am sure I am missing something simple but all this week I have been watching youtube videos about how to animate images (as I can’t find anything about animating PShapes) and creating an array of images. However none of them quite work with 3D shapes or do what I want (the generation of these Pshapes to be controlled by an array which will have my data values in).

Right now I am watching a series from the coding train on youtube about creating a solar system in which a range of planets rotate around the sun in a 3D space. I thought this could help me as it is generating multiple elements in a 3D space. I have started from the start, watching the 2D shapes video as to not get lost. I followed along creating the code as I went.

I learnt how to make a class and how to call on it. Despite watching these videos I don’t quite understand everything this code is doing.. Nonetheless I thought perhaps the spawn.Moons variable could be quite useful in generating multiple hands in my code, replacing the sun.spawnMoons(5) as a set int value with an array.
The first thing I tried was to simply change the names of the variables/floats and replace the ellipse with my load obj function. This didn’t work, I think it struggles with the idea that both Hand and hands are the same obj?.

Also even though it is fine in the solar system model it doesn’t think that hand is variable? ‘hand’ just replaces planets word for word I think so not sure what is going wrong? I deleted some elements such as the rotate float as I wanted to see that it would work on a more basic level..

I will watch part two today, where they go through how to convert the 2D design into 3D. This is less helpful to me but perhaps it will give me some insight into how they get it to work in a 3D space. I have doubts that it will go into PShapes but I am trying to understand how to do this however I can!

data collection

week eight – thursday 19 september

I took a quick look at census data and the only measurements they have are about forearm length and hand span – nothing about middle fingers.
Although it wasn’t too hard to get data from people. I also asked each participant what (or who) they wanted to dedicate their middle finger to – I hope to include this in the booklet, to make each page unique not just in design with the measurements but also personalised.

Lauren – 9.6cm at animal abusers
Brontë – 8.6cm at Trump
Liam – 11.5cm at responsible sleep schedules
Harry – 11cm at chlorinated water
Caspian – 11cm at his own collarbone
Aidan – 11cm at climate change
Victoria – 9.5cm at Brexit

Becky – 9cm at her statistics paper
Tertia – 10.4cm at capitalism
Zeke – 11.4cm at grades
Keegan – 11.6cm at drunk drivers
Andrew – 11cm at deforestation
Senna – 11cm at fake friends
Ellie – societal expectations

Now I am still not sure how I am going to have this data influence the OBJ scan, I’m thinking I want it to have the measurement dictate the number of fingers on each page? and then create a random pattern of sorts. If I was to do that I would have to round up/down to whole numbers.

Based on this data I am now thinking about this booklet as an expression of anger and frustration within my generation, at the world around us, our economy and social climate as well as just personal stuff we have going on in our lives. Rather than just a booklet to be provocative and funny.

3d scanning

week eight – thursday 19 september

So I visited the FabLab to discuss with them what I wanted to do in terms of 3D scanning and they said that their 3D scanner scans an object sitting within a machine, this would not work for my plan to scan a hand.. They suggested that I talk to the people at the 3D Industrial Workshop about their 3D scanner.

This 3D scanner flashes lights at an object and generates a mesh file on the laptop as it goes. The object needs a base of sorts to ground the object. If the scan on the computer is green it is capturing, if it is red you are moving too much/too close for capture, if it is blue, you are too far away.
The scanner struggles to capture the underside of an object but it can work around a more unusual shapes than that of the FabLab scanner. I was also told that it struggles with shapes that are smaller than about 15cmX15cm.

This was the shape that I 3D scanned in my induction.

Once you are happy with the detail of the mesh scan you apply a range of tools to the file to refine it. You can also use the editor to remove sections of the scan, such as the base.
Then you can export the file as an OBJ or an STL.

I then used the rocket example processing file as a starting point in brining in OBJ files into processing as PShapes. This generated a whole lot of errors and didn’t work..
A previous load of an OBJ file I downloaded from online using the same format however did work (with some errors showing). I still have no idea why one worked and the other didn’t.

But because time is a pressing matter I needed a hand scanned soon. I needed a hand than my own, firstly so I could scan it and secondly because I was worried my hand was too small to be captured, I was already pushing it a bit with trying to scan something smaller than 15cmX15cm with such detail.

This is the initial scan of Isaac’s hand once I removed the base (my base was made of a piece of cardboard with a hole in the middle and a black sheet with a hole on top of that – Very high tech I know. Isaac had to pretty much lie on the floor so I could scan his hand.)

I then applied a bunch of tools & hole fixers to actually get it to look like a hand. I also saved a bunch in between each of these edits as I still didn’t know why the other practice scan I did wouldn’t load in Processing and wanted to have every version available if I needed it.

The order of the edits in this slideshow is;
Outlier Remover, Global Registration, Smooth Fusion, Hole Filler (selection), Hole Filler (completed).

I was actually so surprised that it worked, here are some videos I took during the refining process.

Then to make sure that my model had the best chance of actually working in processing I refined it through the MeshLab program.

initial output + workflow concept

week eight – thursday 18 september

  1. 3D scan of hand (.obj file)
  2. Bring into Processing (using SAITO OBJLoader possibly?)
  3. Get data set of finger measurements (either from census or people irl – tbd)
  4. Use data as an array & ‘for’ loop to generate pattern with hand.obj in Processing
  5. Compile into a booklet of personalised hand patterns to print

tasks for step one
FabLab Inductions to complete
– About Fab Tour (10am Wednesday 25th)
– 3D Scanning (tbc – not enough applicants)

tasks for step two
Possible videos/sites to watch/read about bringing .obj files into processing and manipulating them:
https://www.youtube.com/watch?v=6VSaneuiaWs
https://processing.org/reference/loadShape_.html

tasks for step four
videos that go over using 3D objects in processing, perhaps could use a combination of what I learn from these to create this pattern that can be dictated by the finger measurements.
https://youtu.be/7BoJBYh16CQ
https://www.youtube.com/watch?v=YcbcfkLzgvs&list=PLRqwX-V7Uu6bb7z2IJaTlzwzIg_5yvL4i
https://www.youtube.com/watch?v=EC5R8NtBo5A
https://www.youtube.com/watch?v=Y6EJYjQjVVs
https://www.youtube.com/watch?v=4KKTECjP7TY

tasks for step five
ask about where to go & how to print booklet. (perhaps during FabLab induction talk to people there?)

data inputs

week eight – thursday 19 september

lecture notes:
processing – Function()’s do things, Variables store & classify information. There are a range of different types of variables, we need to tell Processing what type of variable we are dealing with so that it knows what to do with it.

Some new variable data types to make note of are,

String – multiple characters, for example, names.

boolean – are true/false variables that can act as on/off switches, for example you would use this when you wanted specific to happen when a mouse is pressed.

array – a list of data, for example you could have an intArray, stringArray, hexArray etc.

int – Numbers, for example birthdays. these are whole or negative numbers. By defining a number as an integer processing can understand what to do with it, such as multiply, use as coordinates, divide etc..

float – Numbers that are fractions or decimals, these can also be whole numbers.

‘for’ loops
These loops allow for multiple varied functions to be carried out in a few lines of code rather than many.

for(int k = 0; k<3; k++){ function }

‘for’ is kind of like a function
‘int k = 0’ is the init, it defines the initial k value as 0.
‘k<3’ is the test, the number is the number of times the code runs, if the test is false (eg: k is more than 3) the forloop stops running.
“k++’ is the update, this describes what we want to happen each time the loop runs. ++ means add one each time, this can also be written as k = k+3, in this form the number can be substituted for whatever is needed in the context.

The variable that is defined (k in this case) can only be used within the curly brackets of the for loop.

for’ loop pair tasks:

precedents of data visualisation

week seven – thursday 12 september

Red Bull Party Visualisations (CleverFrankie + Byborre – 2017)
During a party in Amsterdam, guests were given a special bracelet (designed by Byborre) with a sensor that would collect data about their experience in the club (Coded by CleverFrankie). It collected information about what part of the club they were in, movement, temperature and heartbeat. At the end of the night, when the guest gave back the bracelet, they were given their own print of data art created with the data collected throughout the night.
During the night this data was also presented to the guests on a large screen in the main stage as live visualisations.

Personally, I have chosen this precedent because of the visual colours and contrast in the visualisations (both digital and paper). In my output I wish to use an engaging and relevant colour palette to elevate the design as this one has. I am also interested in the way that CleverFrankie used data to create a unique design for each guest.

Live Visualisations
Personalised Visualisation Prints

OddityViz (Valentina D’Efilippo + Miriam Quick 2017)
The project visualised data from David Bowie’s 1969 track Space Oddity on a series of ten engraved vinyl records with accompanying posters, plus a movie image piece. Each 12-inch record visually deconstructs the track in a different way: melodies, harmonies, lyrics, structure, story and other aspects. The designer in this project was Valentina D’Efilippo accompanied by researcher Miriam Quick. This data visualisation won the ‘information is beautiful awards’ in 2017.

A possible idea that I had considered for my output was to visualise songs through colour and imagery (photographs). This would be a very personal interpretation of each song. In order to include the aspect of data and code in this output I would need to do something similar to OddityVis, by visualising the sound of the song itself and that data, rather than just what I picture when I listen to my favourite songs. Still a possible avenue however.

Planet Earth (Federica Fragapane + Chiara Piroddi 2016)
The book provides a new and innovative narrative of our world to the children, depicting it with the tools of infographic and data visualisation, combined with colourful illustrations.
The book has been created by Federica Fragapane – Information Designer and Illustrator – and Chiara Piroddi – Psychologist, Expert in Developmental Neuropsychology. The combination of the two different professional figures allowed to work on a project extremely focused on the accessibility of the information to a young public and at the same time on the creation of a visually evocative storytelling tool.

I have chosen to include this precedent as an inspiration as to how I could present data and measurements of things/people in an illustrative way that still includes a representation of the data itself. A possible avenue I am considering doing a booklet with measurements of people (not sure what of yet), each page a different person and a different designing response to the data (measurement) of each individual.

code that creates

week seven – thursday 12 september

lecture notes:
Assessment two is about using code to create a physical creative output.

What is driving your output?
Design Principals
contrast
movement
balance
scale
perspective
rhythm

Data
sound wave
random numbers
mouse movement/tracking
census data
health data (Fitbit, smart watch etc.)
traffic
global data
screentime

How to turn this data into code?
Most past students have used processing to bring their data into code as it is an easy program to bring in data sets and to generate different file outputs for a creative final.

Processing can make 2D and 3D files (and is going to be the one that is mostly taught to us in lectures).
Different objects need different file formants, for example for printing you have PDF(vector),PNG,JPG(bitmap) etc.for 3D printing you need files similar to OBJ, STL, 3DX

How we covert coding to PDF’s?
  Java examples – libraries – pdf export – select type of pdf
One helpful type of PDF that processing can generate for you that we covered in class was mousePress.

mousePress
all sketches are save into sketch folder, however saves over each one the same time. To save multiple on mouse press use the ‘manyPDF’.

How to we convert coding to 3D object files?
  sketch – import library – import library
Suggested libraries to use are:
HE_Mesh and OBJExport (restart processing once installed)
HE_Mesh allows you to generate and modify a shape in processing.

Other programs that will be helpful in creating 3D files that can print from your code:
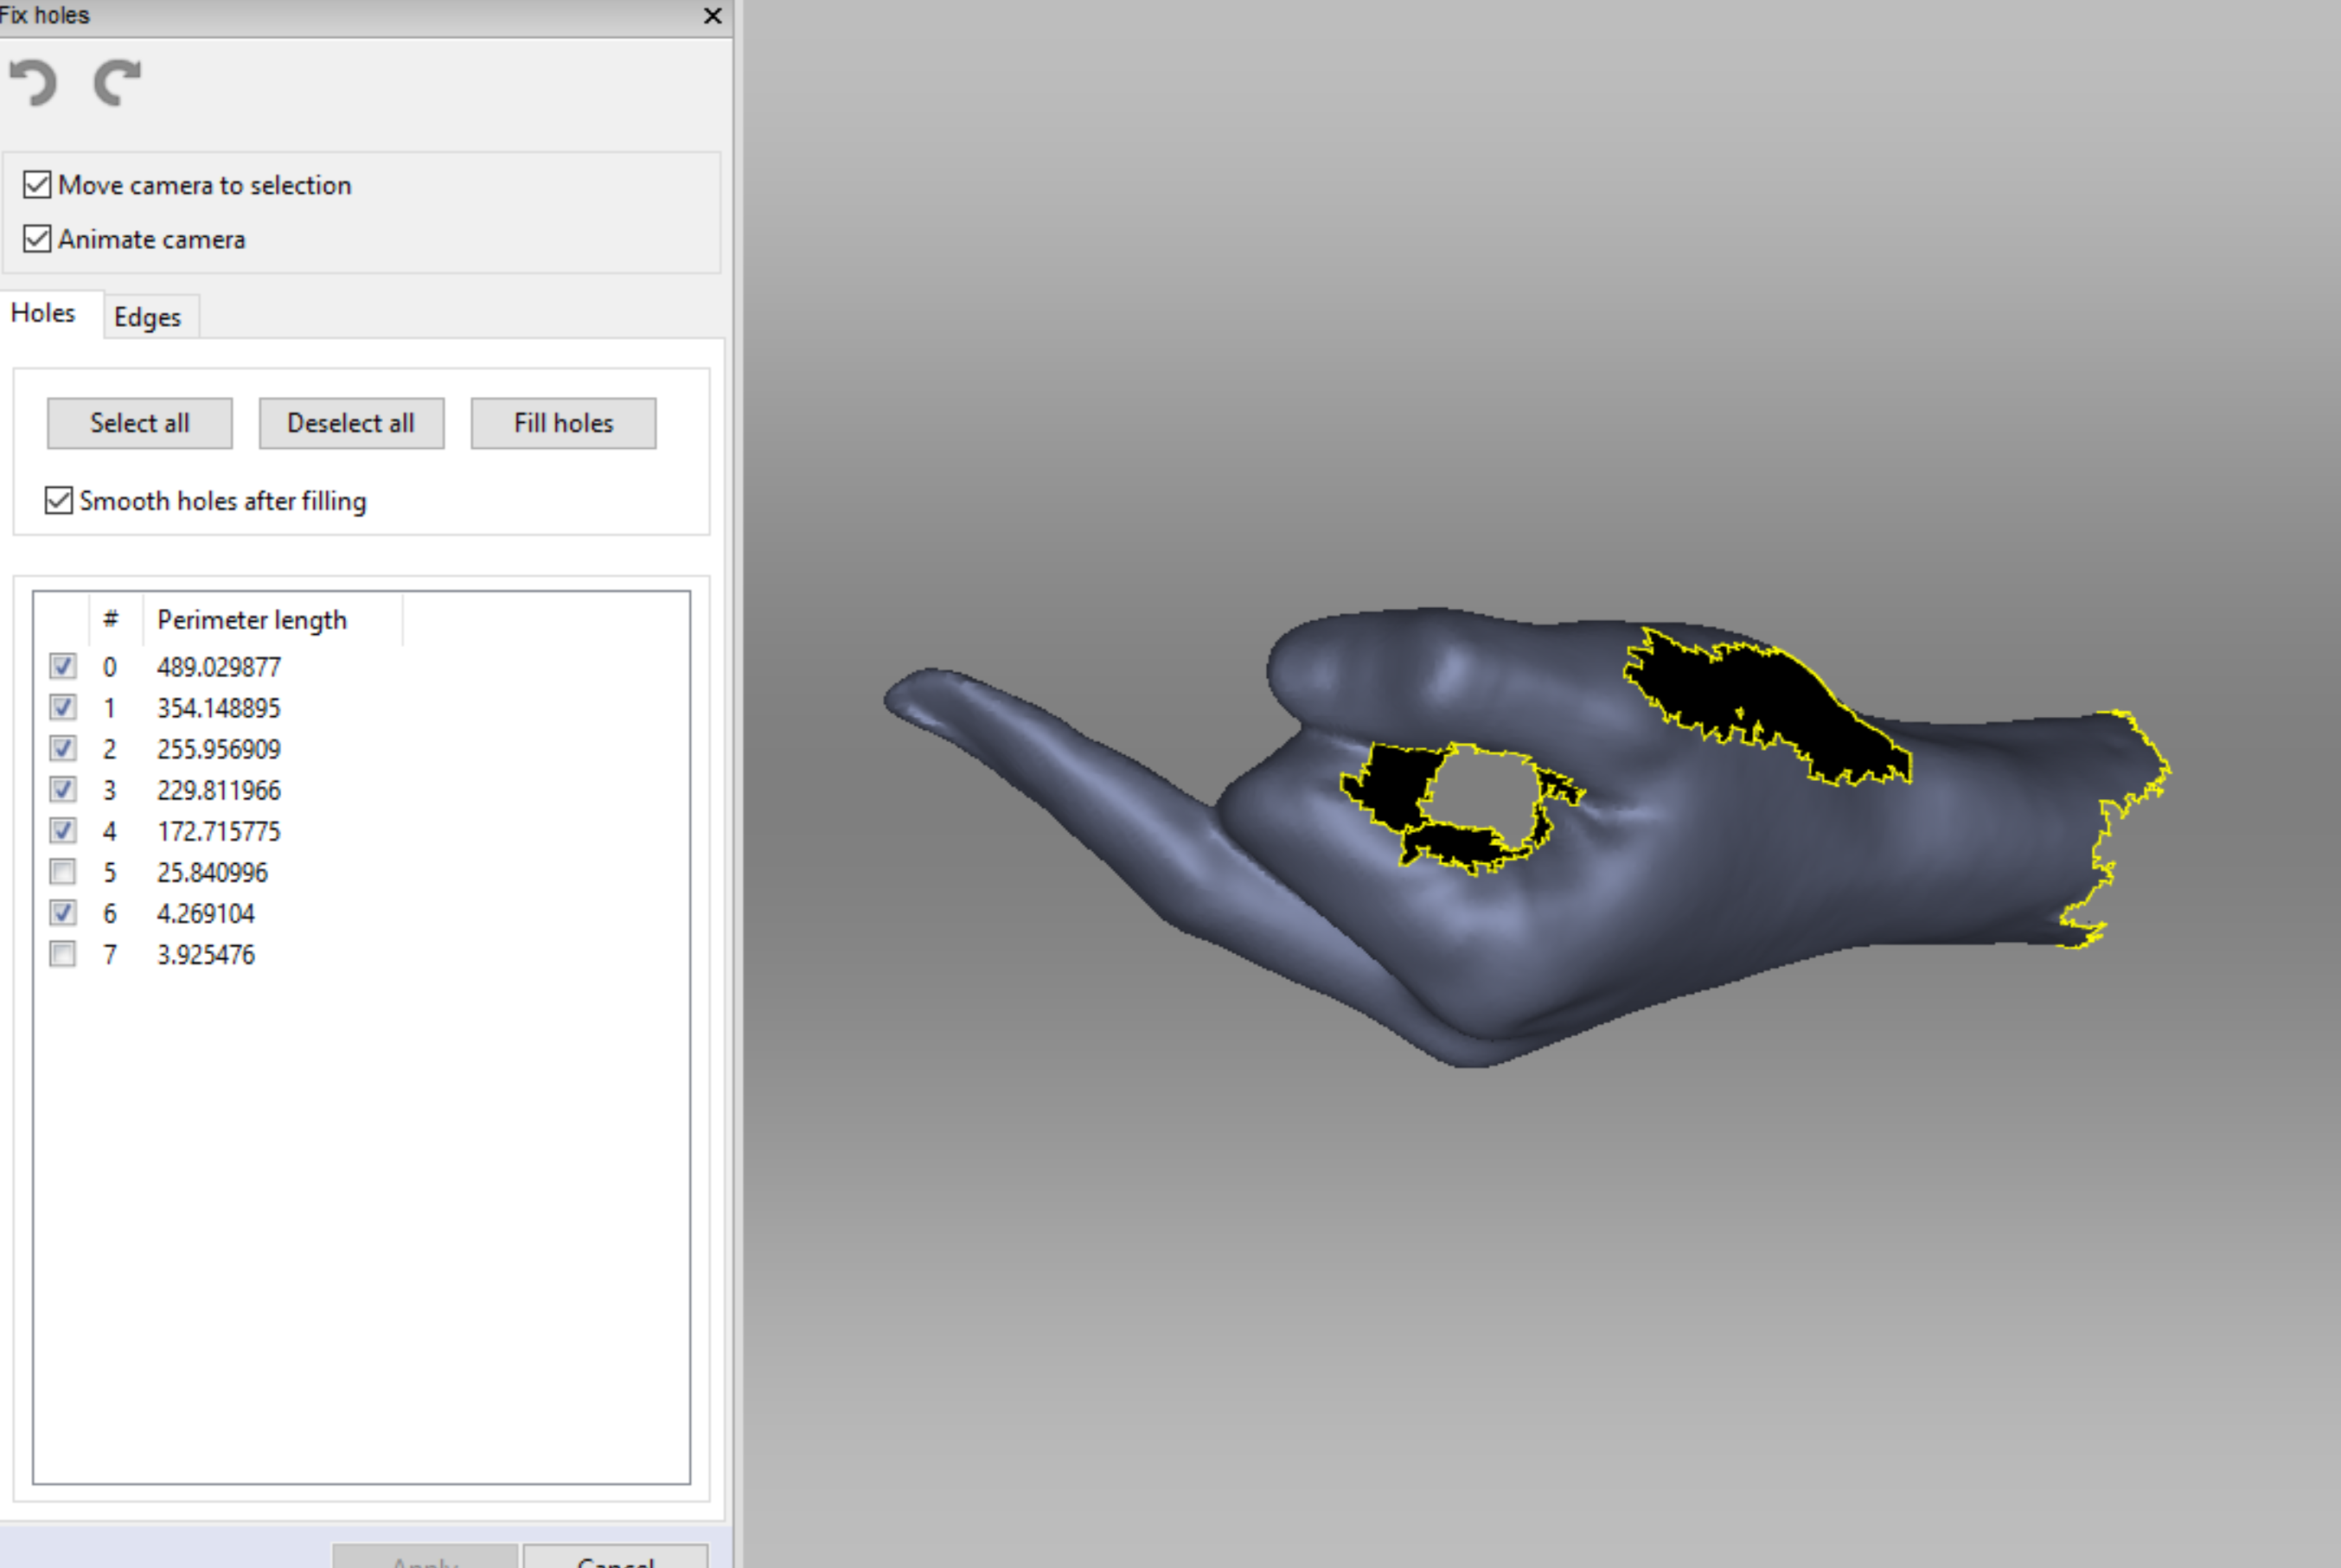
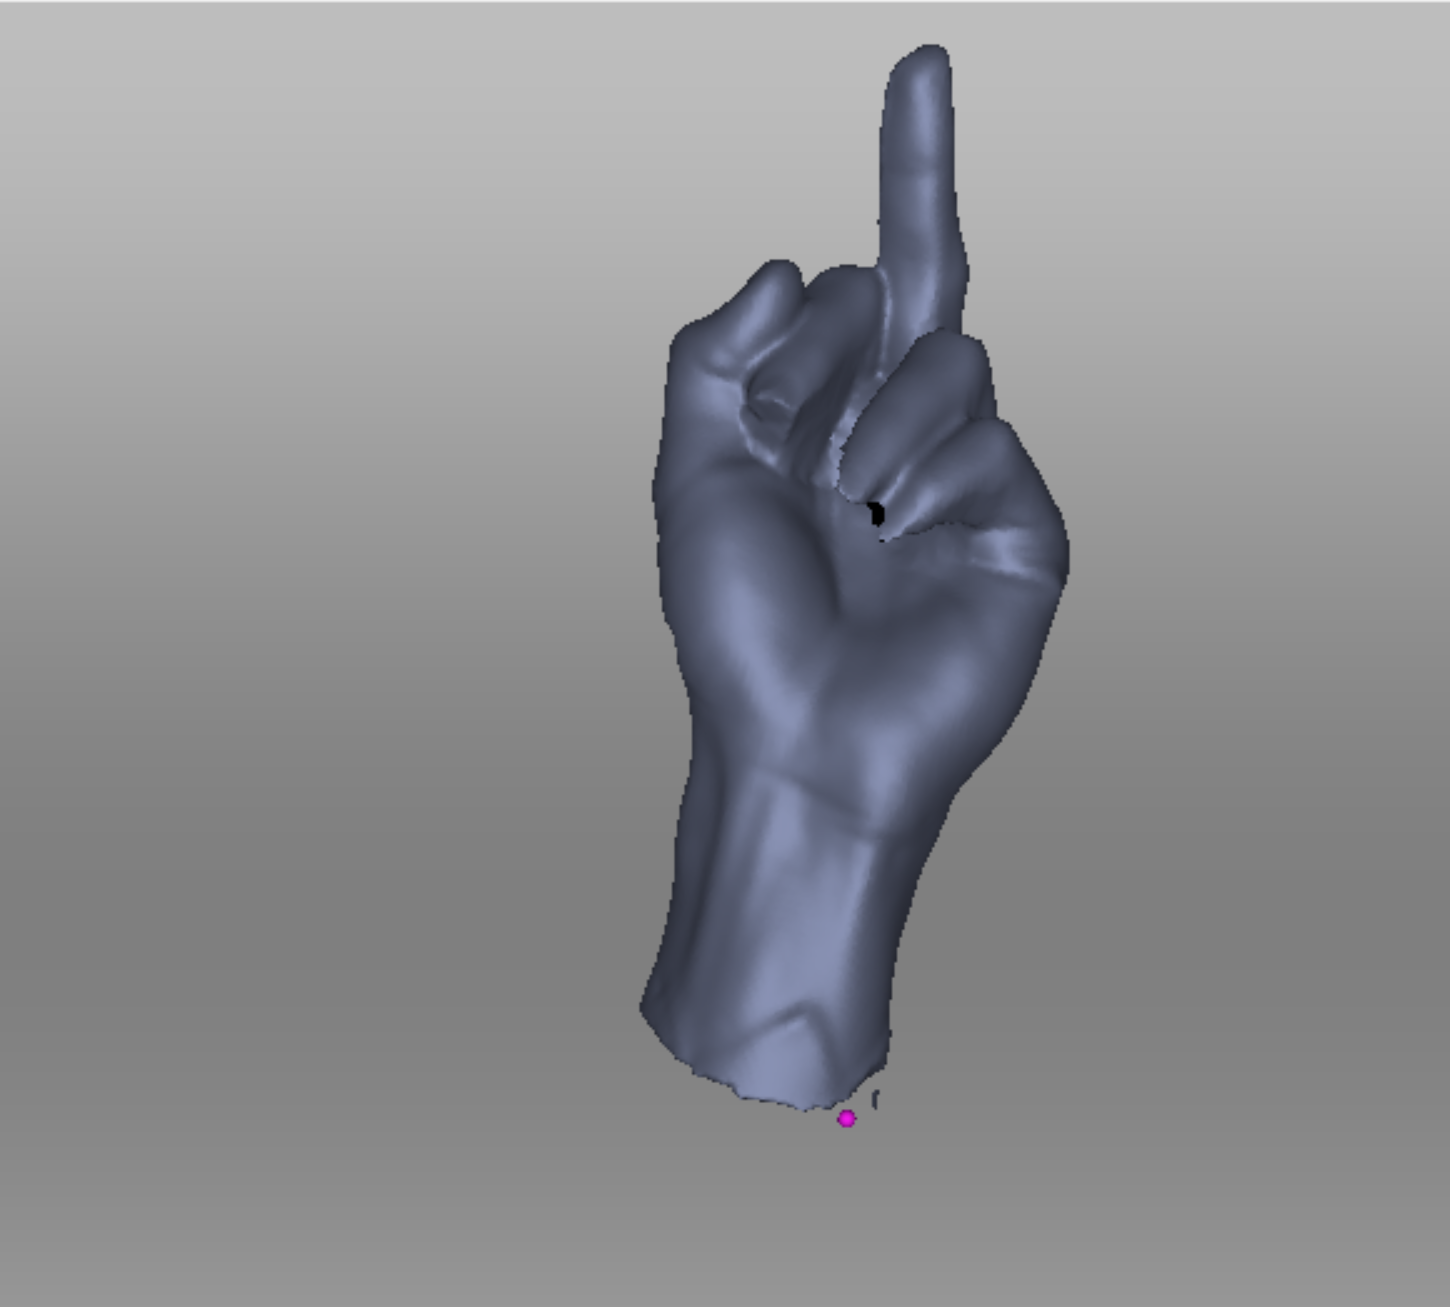
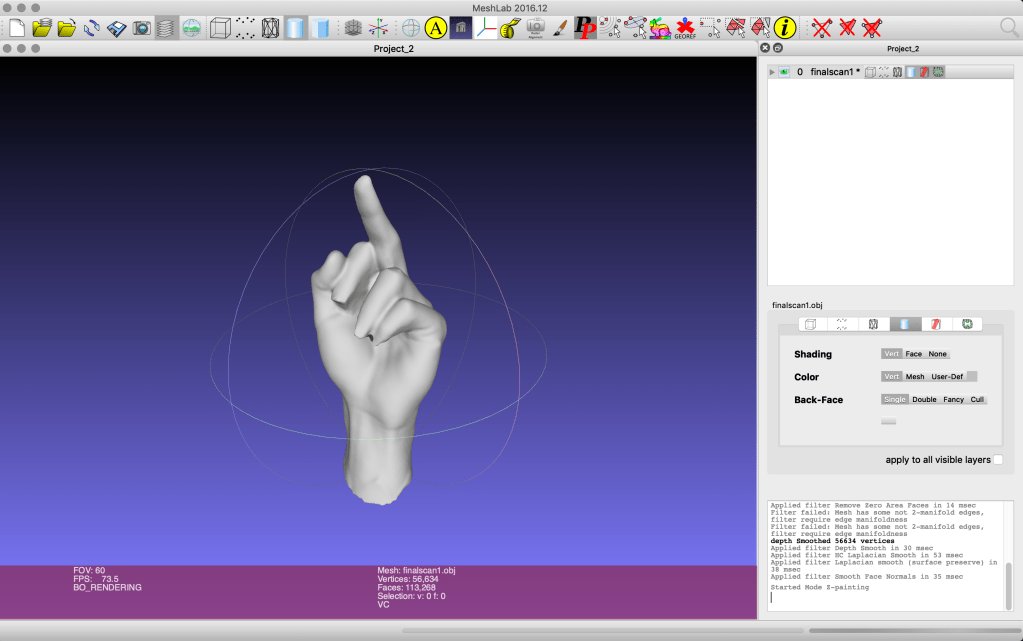
Mesh Mixer – sometimes mesh you generate is an impossible mesh, this program helps you fix mesh errors.
Slicer (for fusion 360) – can import your STL, allows you define size, construction technique – you can download a pdf of these files.

What can I make as a final output?

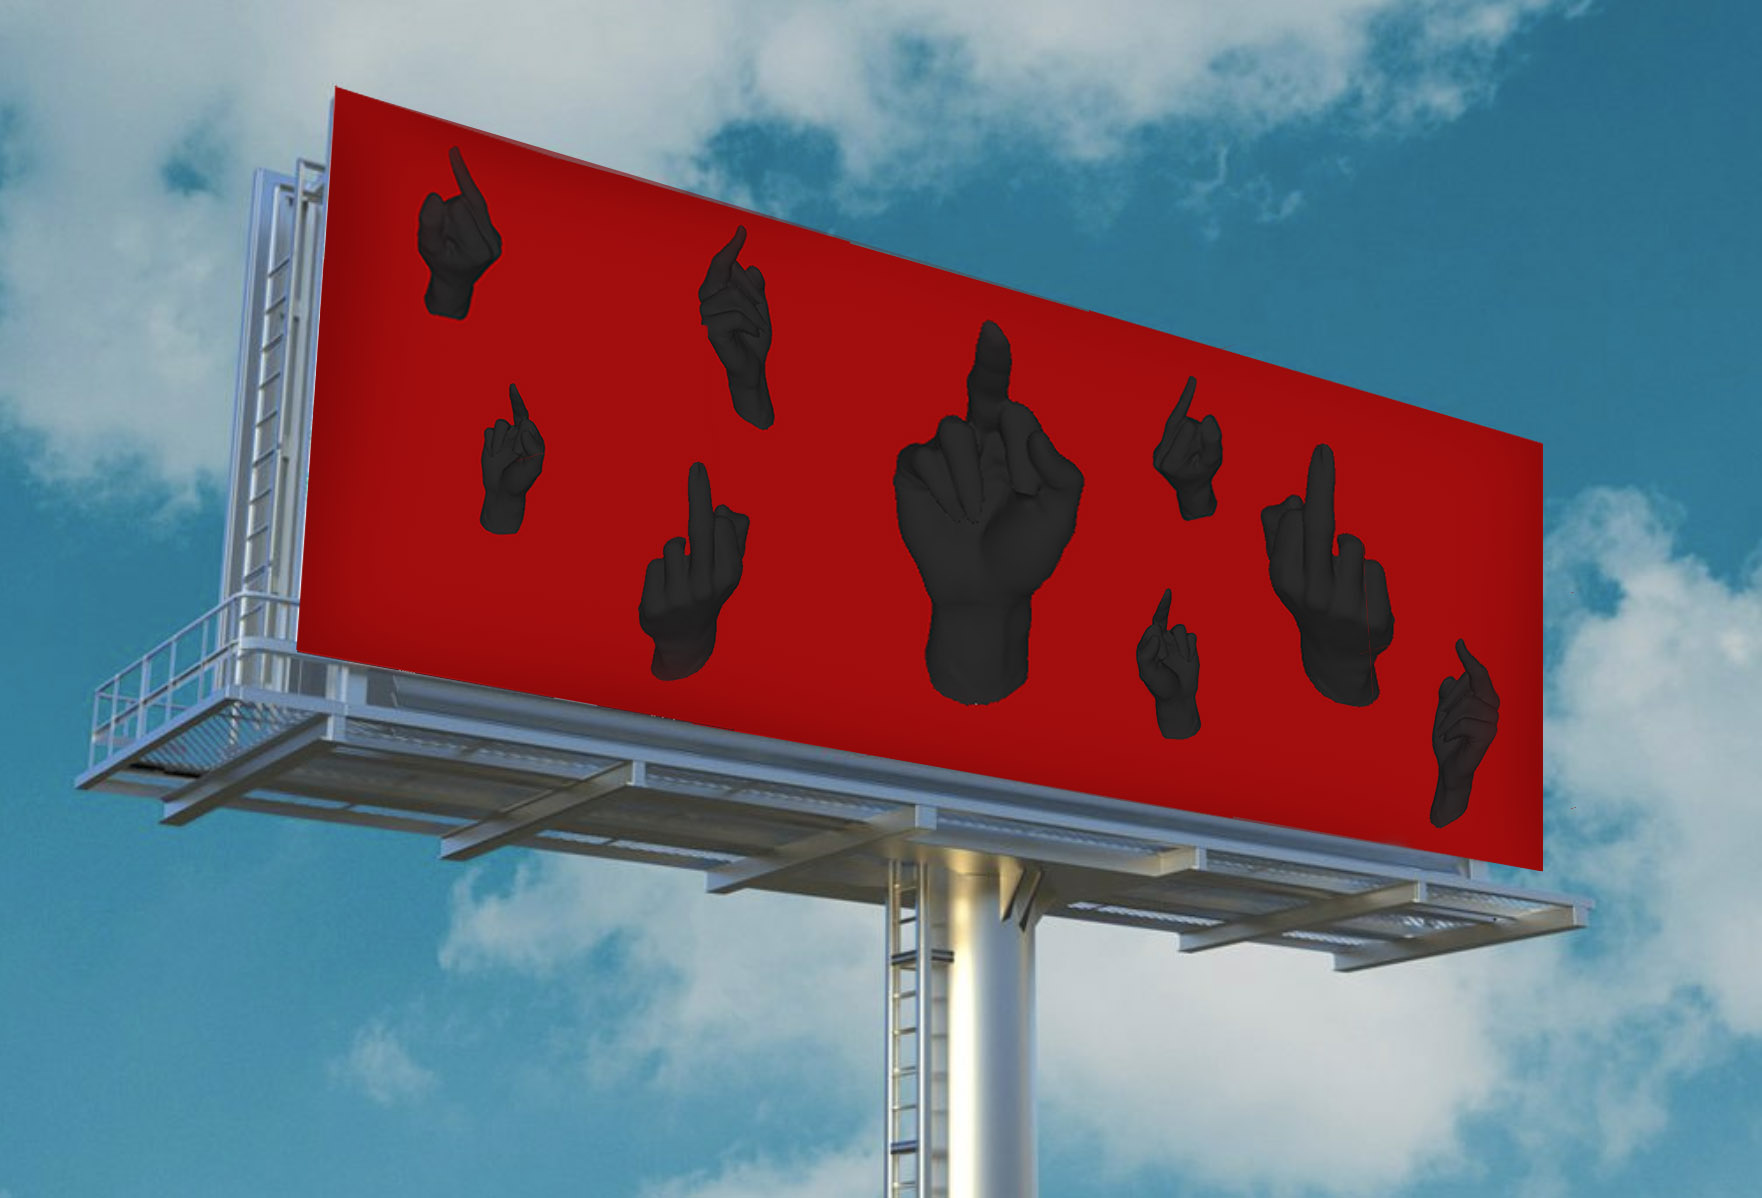
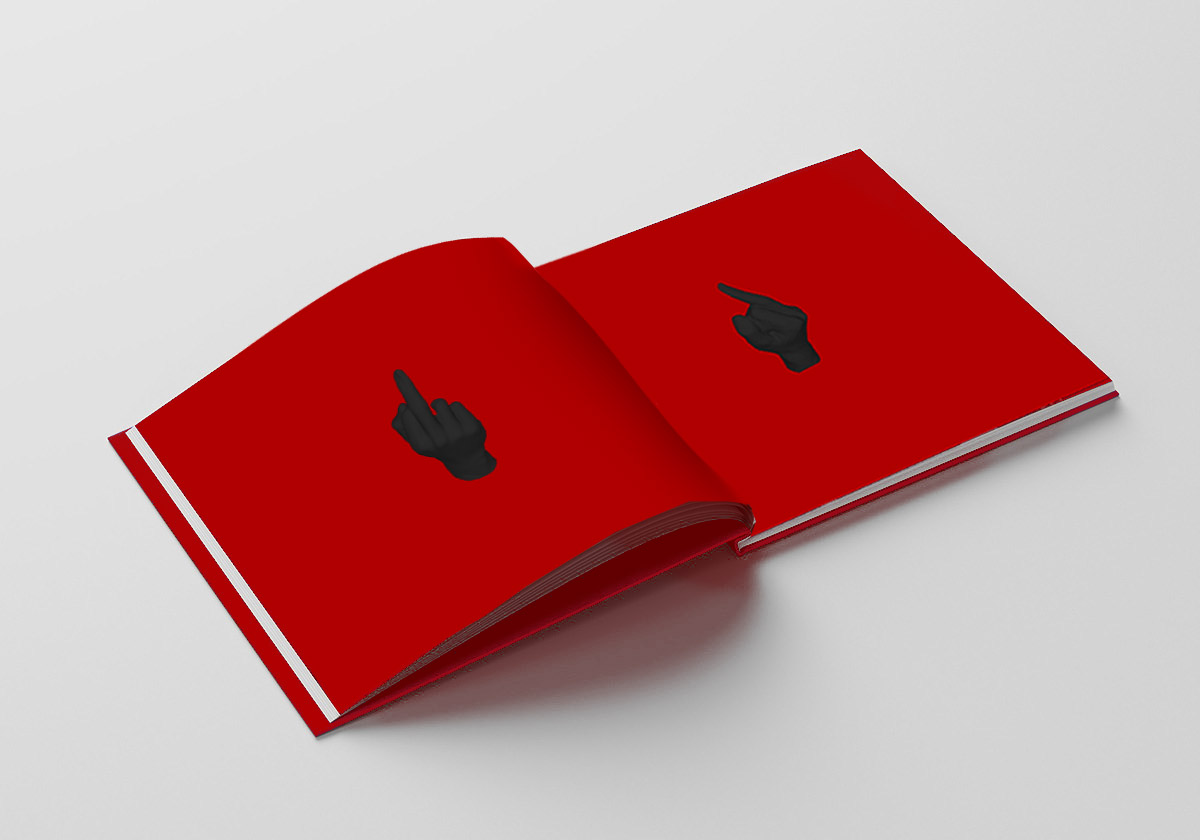
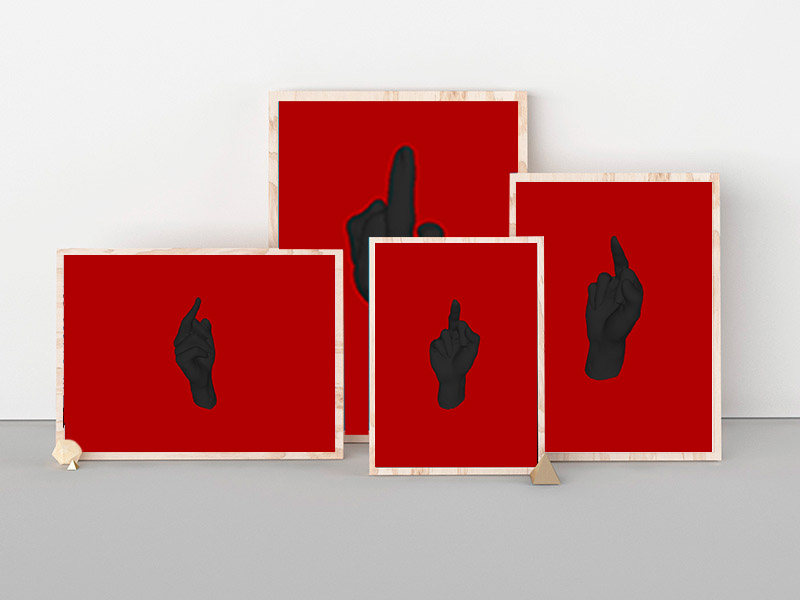
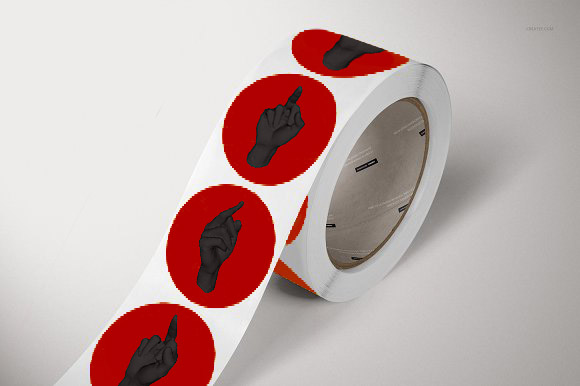
“The final manifestation of your outputs could be realised through 3D printing, laser cutting, various printing formats (book, poster, postcards, OHP, vinyl), folding.”

Think about where can this object go, what different environments be applied to is something to consider when developing your concept.

3D Object
  3D Printing
  Laser Cutting (wood, card/paper, fabric, plastic)
  Water Jet Cutting (stone, tile)
  Wax Mold
  Folding (paper, card etc.)
  CnC Milling (carves wood)
  VacForm
  Knit

Print
  Paper Print (posters, books, pamphlets, zine, card etc.)
  Laser Cut (etching, cut a base to print onto)
  Screen Printing
  Vinyl Cut/Sticker

Experiential Instillation
  VR
  Projection (on something other than a screen)
  Misc. (after discussion with lecturers)
should be live rather than static, unique to each run through/interaction and the audience has a part to play in each run through, physically interaction with the output.

Design a site like this with WordPress.com
Get started